Display analytics
NOTE: You can break down display ad metrics by ad group keywords.
We measure the following display ads metrics—
Spend: How much budget your ads spent.
Ad viewable impressions: An ad viewable impression is counted when at least 50% of an ad is viewed for at least 1 second. Accredited by the Media Rating Council (MRC)**.Clicks: Number of times users clicked your ad. Accredited by the Media Rating Council (MRC)**.
Click-through rate (CTR): Percentage of Ad viewable impressions that resulted in an ad click. Accredited by the Media Rating Council (MRC)**.
Direct sales: Your campaign product sales in USD or CAD, as applicable, after a user views or clicks your display ad.
The attribution window lasts 14 days.
View-through attribution measures sales after a user views your ad without clicking on it. Learn how to choose which display ad and shoppable display universal product codes (UPCs) count toward view-through attribution.
- Attributed units: The number of units sold after a user views or clicks your display ad.
Halo sales: Similar to direct sales, but also includes related products outside of the campaign (e.g., different flavors, pack sizes, and product varieties in the same brand for your category*). Halo sales can be lower than direct sales. Learn more about interpreting sales data.
Return on ad spend (ROAS): Direct return on ad spend (direct attributed sales, divided by spend).
Halo ROAS: Halo return on ad spend (halo attributed sales, divided by spend).
Average cost per mille (CPM): Cost per 1,000 impressions.
New-to-brand* sales: Sales that came from consumers who haven’t purchased from your brand within the last 26 weeks. This data is available from August 1, 2022, onward.
New-to-brand* sales %: The percentage of all your sales that were new-to-brand sales. This data is available from August 1, 2022, onward.
New-to-brand* halo sales: Sales of your related products that came from consumers who haven’t bought from your brand within the last 26 weeks. This data is available from August 1, 2022, onward.
New-to-brand* halo sales %: The percentage of all your sales that were new-to-brand halo sales. This data is available from August 1, 2022, onward.
We also track metrics for brand pages and legacy landing pages. Learn more about brand page and legacy landing page metrics.
*Brand and category are rooted in the Nielsen hierarchy.
**Storefront and Storefront Pro are not included.
Reviewing ad group analytics
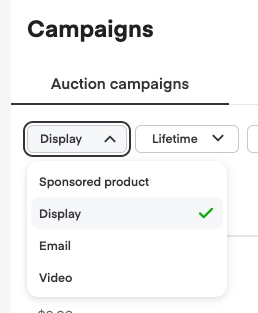
From the Campaigns page, select Display in the drop-down menu on the left.
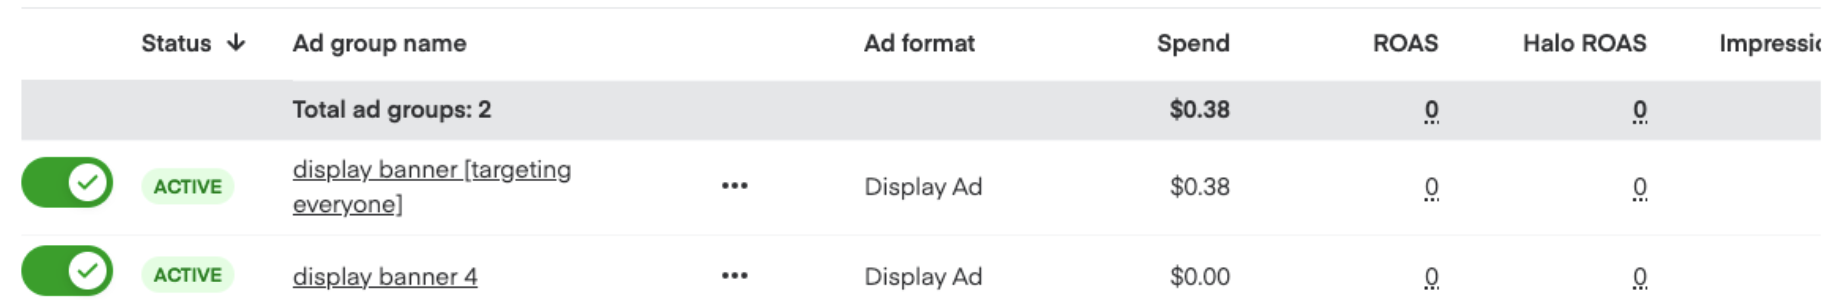
Select the campaign you want to explore from the list.

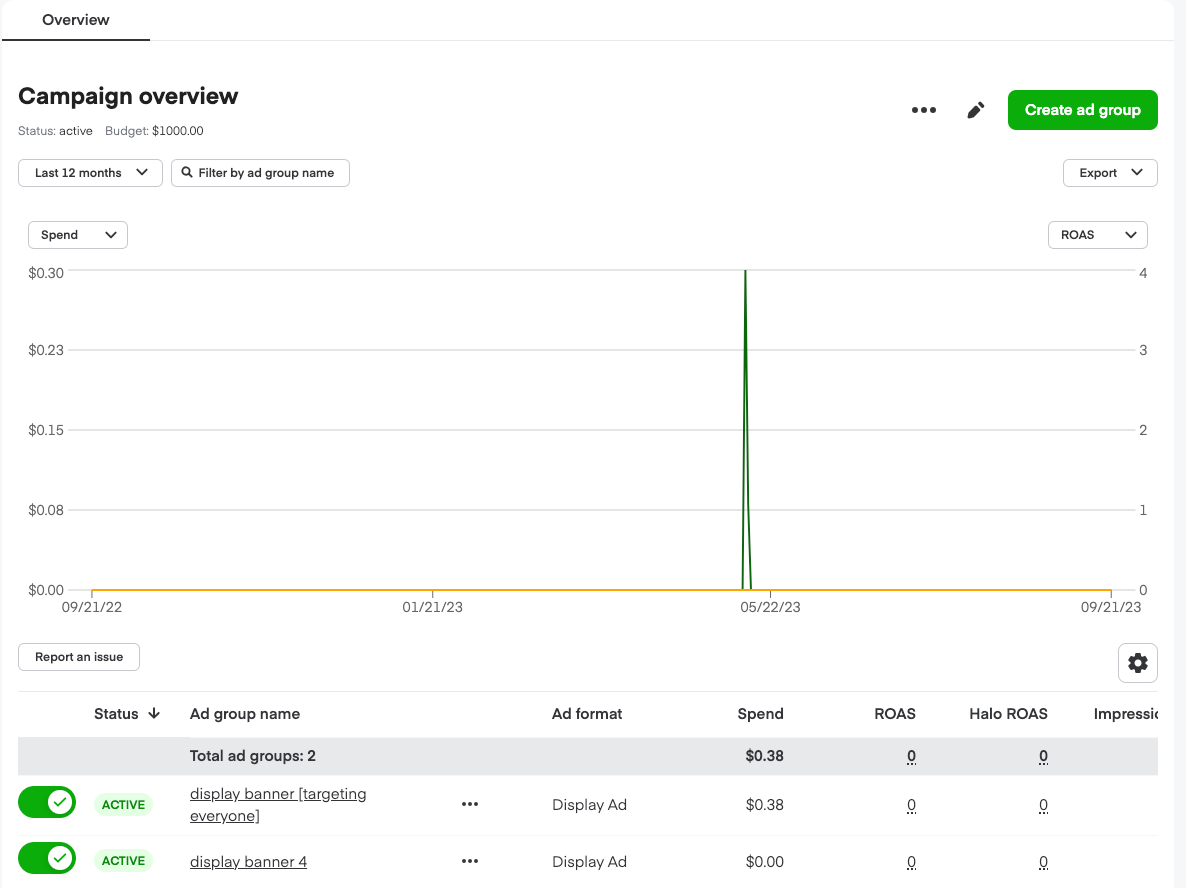
Use the drop-down menus on the top left and right of the chart to change which ad group level metrics you see in the graph.

Toggle the drop-down menu in the top-left to see data from a specific date range.


To view your display ad metrics—
Select the ad group you want to explore from the list.

The Overview page shows display ad metrics. Use the drop-downs on the left and right to change which metrics appear in the graph.
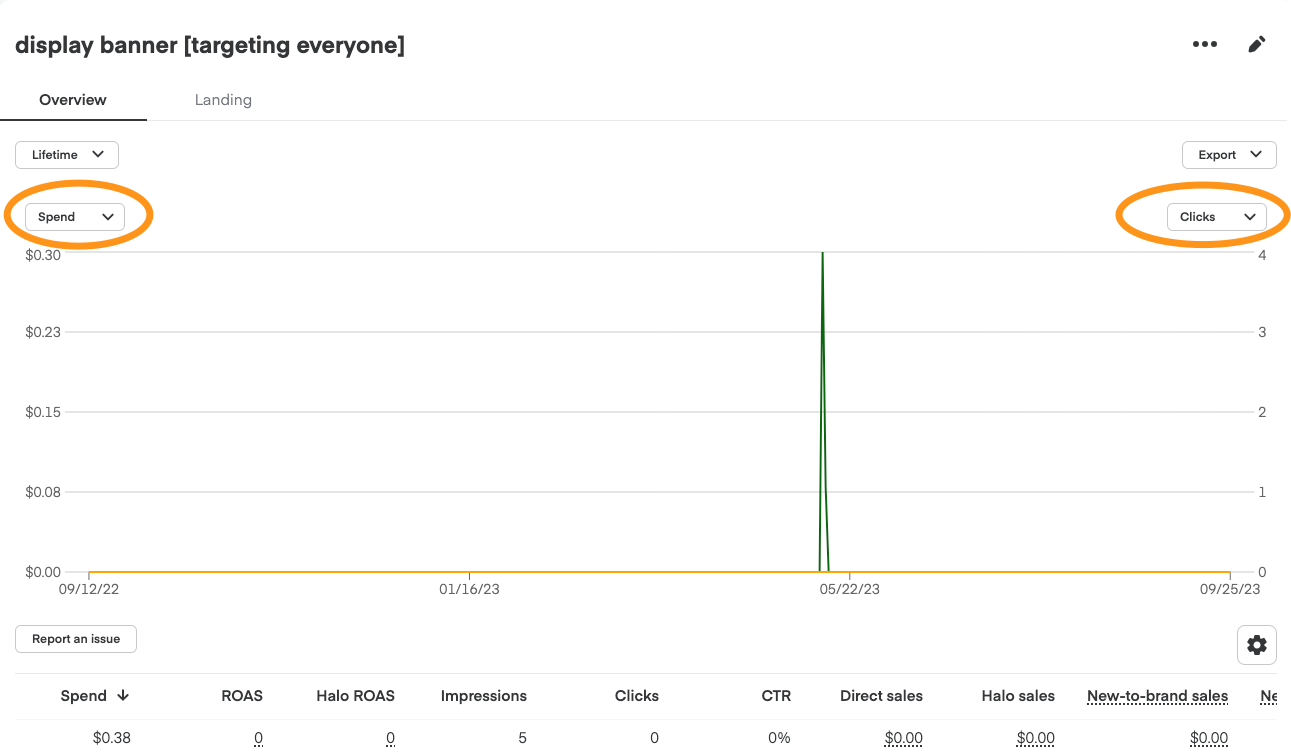

Date ranges work the same in display ad metrics as ad group analytics.
Campaign impressions and clicks reporting—
We provide additional, more granular reporting for impressions and clicks. Learn more about MRC accreditation.
Go to the sidebar navigation on the left.
Select Campaigns (megaphone icon).

Select Impressions & Clicks from the Export drop down.

We measure the following click and impression metrics—
Gross clicks: The total number of clicks on any interactive element of an ad. These clicks can include invalid traffic and other event validations. Accredited by the Media Rating Council (MRC).
Gross impressions: Counted when the entire ad is loaded and begins to render on a device. Accredited by the Media Rating Council (MRC).
Net clicks: Clicks on any interactive element of a display or sponsored product ad. This metric refers to gross clicks in Ads Manager that are filtered for invalid traffic and other event validations. Accredited by the Media Rating Council (MRC).
Net impressions: Counted when the entire ad is loaded and begins to render on a device. This metric refers to gross impressions that are filtered for invalid traffic and other event validations. Accredited by the Media Rating Council (MRC).
Net viewable impressions: When at least 50% of the ad is viewable on a device for at least 1 second. Impressions in Ads Manager are considered “viewable impressions” and are filtered for invalid traffic and other event validations. Accredited by the Media Rating Council (MRC).
Net non-viewable impressions: A net impression that’s recorded but doesn’t meet MRC requirements for viewability, which requires at least 50% of the ad to be viewable for 1 continuous second. Accredited by the Media Rating Council (MRC).
Net unmeasurable viewable impressions: A net impression that’s recorded but the ad was served in an environment in which its viewability can’t be measured. Accredited by the Media Rating Council (MRC).
Net viewable rate: Net viewable impressions divided by (net viewable impressions + net non-viewable impressions). Accredited by the Media Rating Council (MRC).
Net measured rate: (Net viewable impressions + net non-viewable impressions) divided by net impressions. Accredited by the Media Rating Council (MRC).
Net viewable %: Net viewable impressions divided by net impressions. Accredited by the Media Rating Council (MRC).
Net non-viewable %: Net non-viewable impressions divided by net impressions. Accredited by the Media Rating Council (MRC).
Net unmeasurable %: Net unmeasurable viewable impressions divided by net impressions. Accredited by the Media Rating Council (MRC).
Reviewing UPC analytics
You can also see UPC sales breakdowns for display campaigns.
We measure the following UPC metrics—
Attributed units: The number of units sold after a user views or clicks your display ad.
Direct sales: The product sales, in USD or CAD, as applicable, after a user views or clicks your display ad.
Direct New-to-brand (NTB) sales: Sales that came from consumers who haven’t purchased from your brand within the last 26 weeks.
Direct NTB sales %: The percentage of all your sales that were new-to-brand sales.
To view your UPC sales metrics—
Select the ad group you want to explore from the list.
Select Products from the Overview page.


From the Products page, you can select a specific date range and filter by UPC or product name.

UPCs removed from the campaign show as Paused, but will still display sales data —

Reviewing keyword analytics
To view your keyword level metrics—
Click Campaigns > Display in the drop-down menu on the left.
Select the campaign you want to explore from the list.
Select the appropriate ad group.
Click Keywords from the top left. The keyword reporting page shows keyword level metrics. Use the buttons on the right to change which metric (you can see only 1 at a time) appears in the graph.
Date ranges work the same in keyword analytics as ad group analytics.

NOTE: Ads Manager reports performance data in Pacific Time. Metrics update within 24 hours, and a banner appears in Ads Manager if there’s a delay.