Analytics
NOTE: You can break down inspiration ad metrics by ad group keywords.
We measure the following inspiration ads metrics—
Spend: How much budget your ads spent.
Impressions: Number of times users viewed your ad.
OOA impressions %: The percentage of impressions where there is no overlap between the super categories of the ads sponsored UPCs and the super categories of the KW search term.
Clicks: Number of times users clicked your ad.
Click-through rate (CTR): Percentage of impressions that resulted in an ad click.
Direct sales: Your campaign product sales, in USD, as applicable, after a user views or clicks your ad.
The attribution window lasts 14 days.
View-through attribution measures sales after a user views your ad without clicking on it.
Attributed units: The number of units sold after a user views or clicks your ad.
Halo sales: Similar to direct sales, but also includes related products outside of the campaign (ex. different flavors, pack sizes, and product varieties in the same brand for your category*). Halo sales can be lower than direct sales. Learn more about interpreting sales data.
Return on ad spend (ROAS): Direct return on ad spend (direct sales divided by spend).
Halo ROAS: Halo return on ad spend (halo attributed sales divided by spend).
Average cost per mille (CPM): Cost per 1,000 impressions.
New-to-brand* sales: Sales that came from consumers who haven’t purchased from your brand within the last 26 weeks.
New-to-brand* sales %: The percentage of all your sales that were new-to-brand sales.
New-to-brand* halo sales: Sales of your related products that came from consumers who haven’t bought from your brand within the last 26 weeks.
New-to-brand* halo sales %: The percentage of all your sales that were new-to-brand halo sales.
2-second views: When at least 50% of an ad in a video player is viewable and played on screen for 2 consecutive seconds or more. This applies to any 2 seconds of unduplicated video content in an ad that makes it viewable. Shoppable video views are filtered for invalid traffic and other event validations.
- View-through rate (VTR): The total amount of 2-second views divided by gross impressions.
*Brand and category are rooted in the Nielsen hierarchy.
Reviewing ad group analytics
From the Campaigns page, select Inspiration in the dropdown menu on the left.
Select the campaign you want to explore from the list.

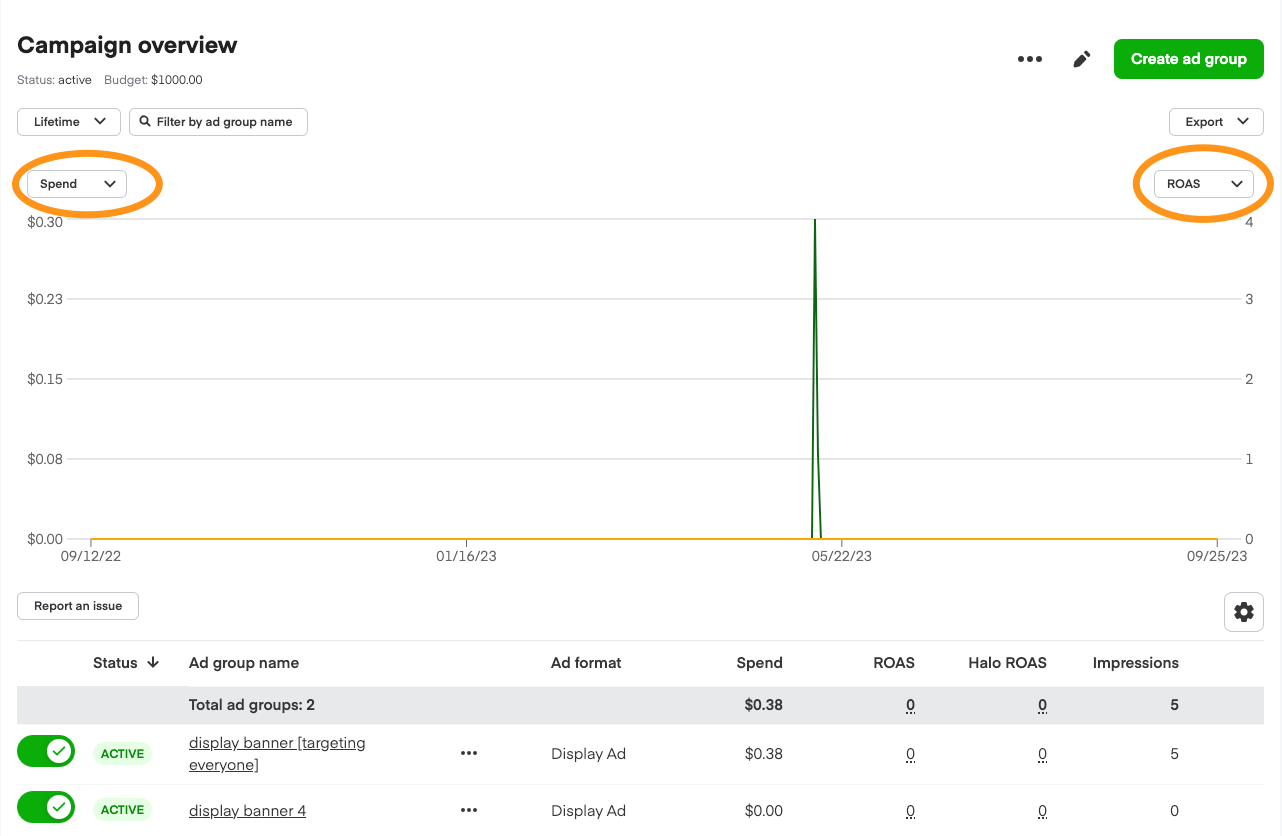
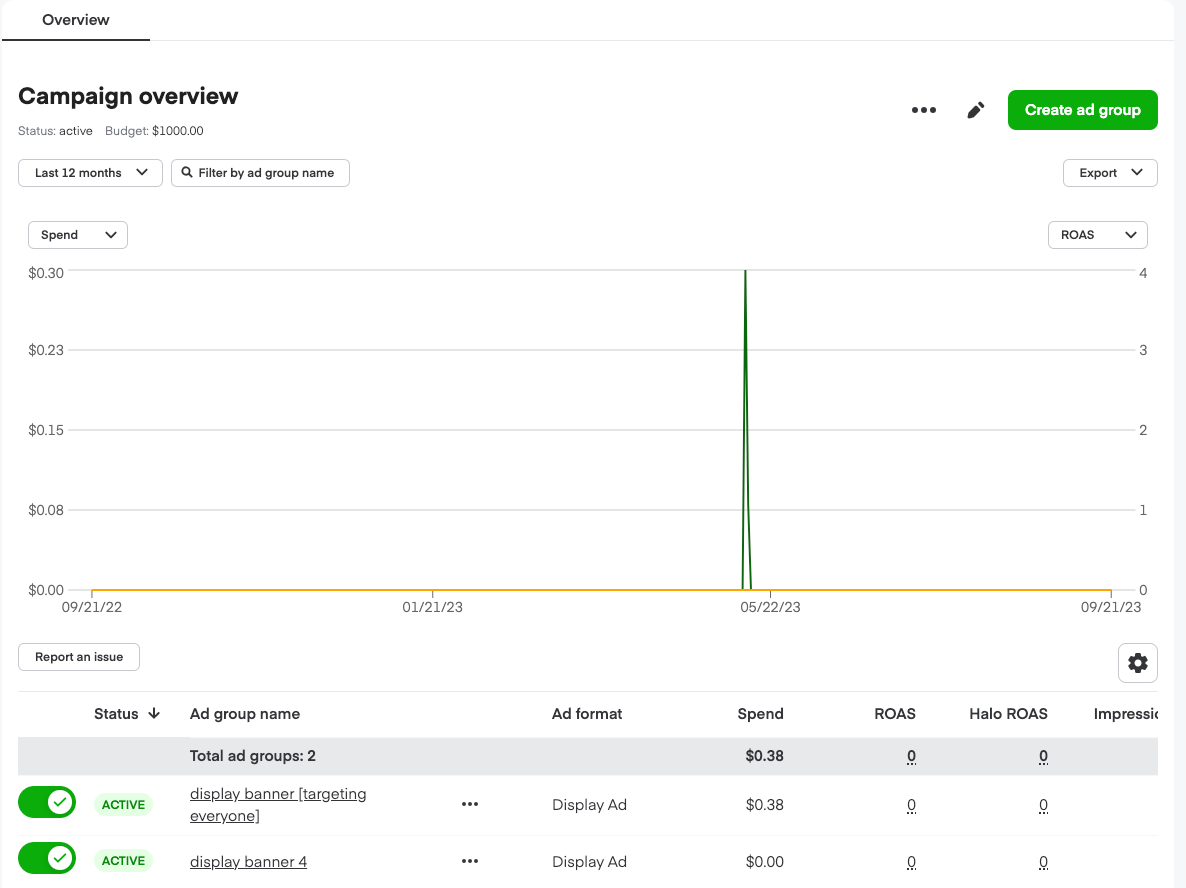
Use the dropdown menus on the top left and right of the chart to change which metrics appear in the graph.
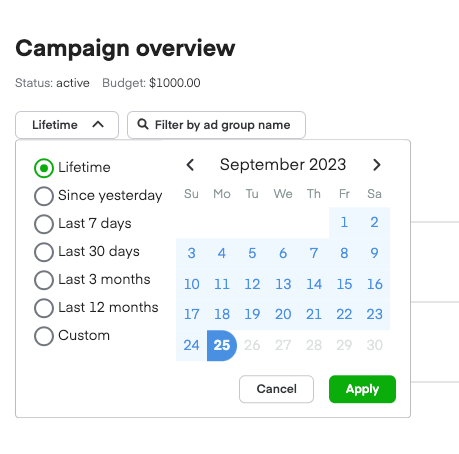
Toggle the dropdown menu in the top-left to see data from a specific date range.
To view your ad metrics—
Select the ad group you want to explore from the list.
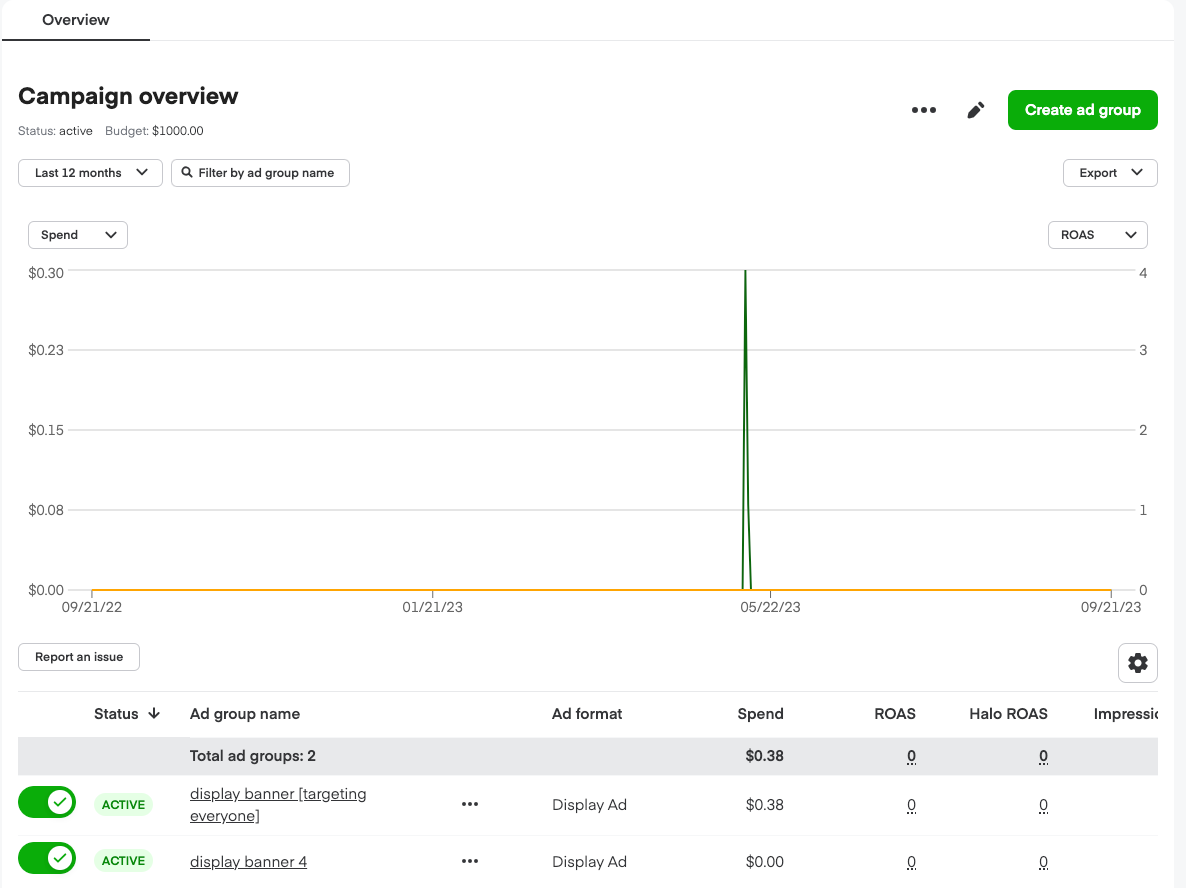
The Overview page shows ad metrics. Use the dropdowns on the left and right to change which metrics appear in the graph.
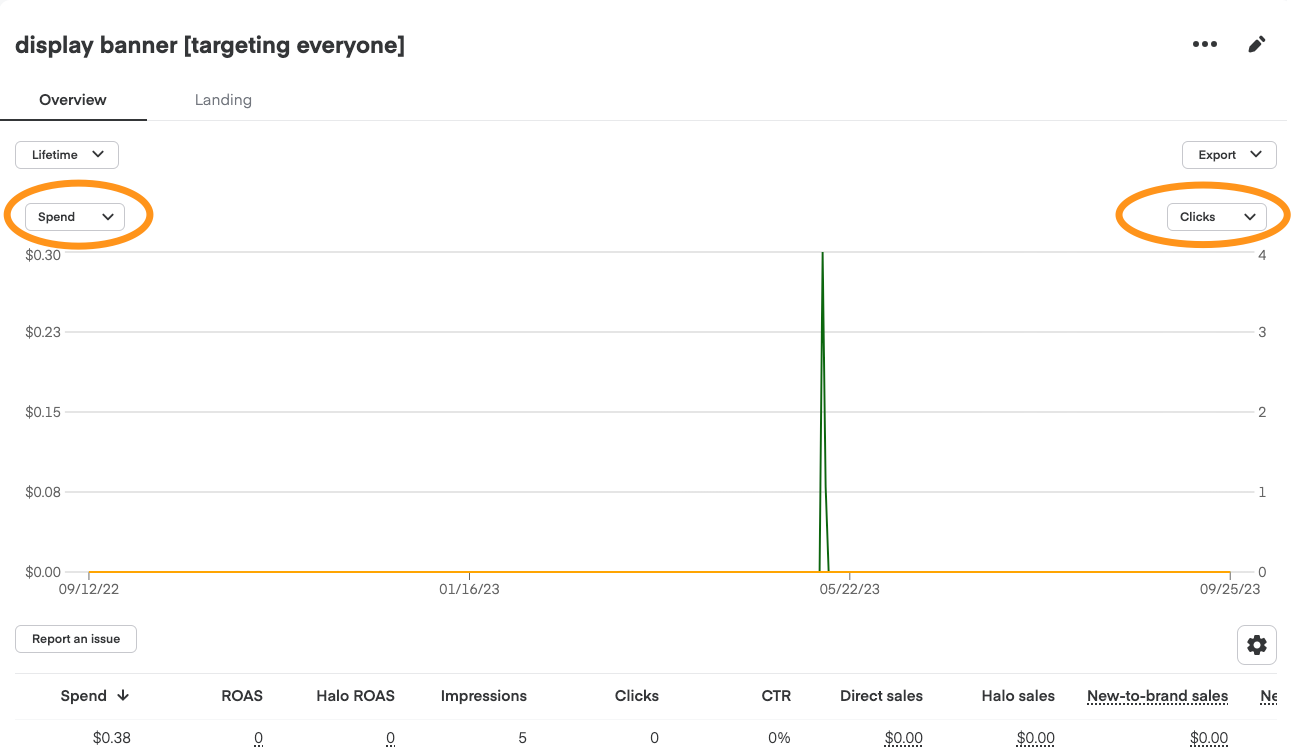
Date ranges work the same in inspiration ad metrics as ad group analytics.
Reviewing UPC analytics
You can also see UPC sales breakdowns for campaigns.
We measure the following UPC metrics—
Attributed units: The number of units sold after a user views or clicks your ad.
Direct sales: The product sales, in USD or CAD, as applicable, after a user views or clicks your ad.
Direct new-to-brand (NTB) sales: Sales that came from consumers who haven’t purchased from your brand within the last 26 weeks.
Direct NTB sales %: The percentage of all your sales that were new-to-brand sales.
To view your UPC sales metrics—
Select the ad group you want to explore from the list.
Select Products from the Overview page.
From the Products page, you can select a specific date range and filter by UPC or product name.
UPCs removed from the campaign show as Paused, but will still show sales data —


