Ads Manager shows a variety of metrics to help you understand your sponsored product performance.
NOTE: Ads Manager reports performance data in Pacific Time. Metrics update within 24 hours, and a banner appears in Ads Manager if there’s a delay.
Performance metrics
We track the following sponsored product metrics in Ads Manager—
Spend | How much money you spend on sponsored product ads. |
Attributed sales | How many dollars in sales resulted from purchases occurring within 14 days of a customer clicking on a sponsored product ad. |
Attributed units | How many unit sales resulted from purchases occurring within 14 days of a customer clicking on a sponsored product ad. |
Return on ad spend (ROAS) | Shows ad effectiveness by comparing ad cost vs revenue. |
Ad viewable impressions**
| An ad viewable impression is counted when at least 50% of an ad is viewed for at least 1 second. |
Clicks**
| How many times customers clicked on the ad. |
Average click-through-rate (CTR)**
| How often an Ad viewable impression results in a click. |
Average cost-per-click (CPC) | How much money you spend, on average, for each click. |
New-to-brand* sales | Sales that came from consumers who haven’t purchased from your brand within the last 26 weeks. This data is available from August 1, 2022, onward. |
New-to-brand* sales % | The percentage of all your sales that were new-to-brand sales. This data is available from August 1, 2022, onward. |
*Brand is rooted in the Nielsen hierarchy.
**Storefront and Storefront Pro are not included.
View your analytics
You can view sponsored product analytics for your entire account, or for specific campaigns, ad groups, products, or keywords.
First, open the Sponsored product campaigns page—
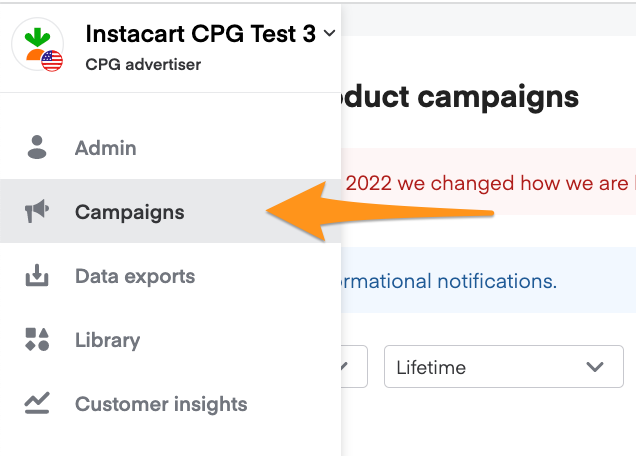
Click Campaigns from the menu on the top-left side of the screen.
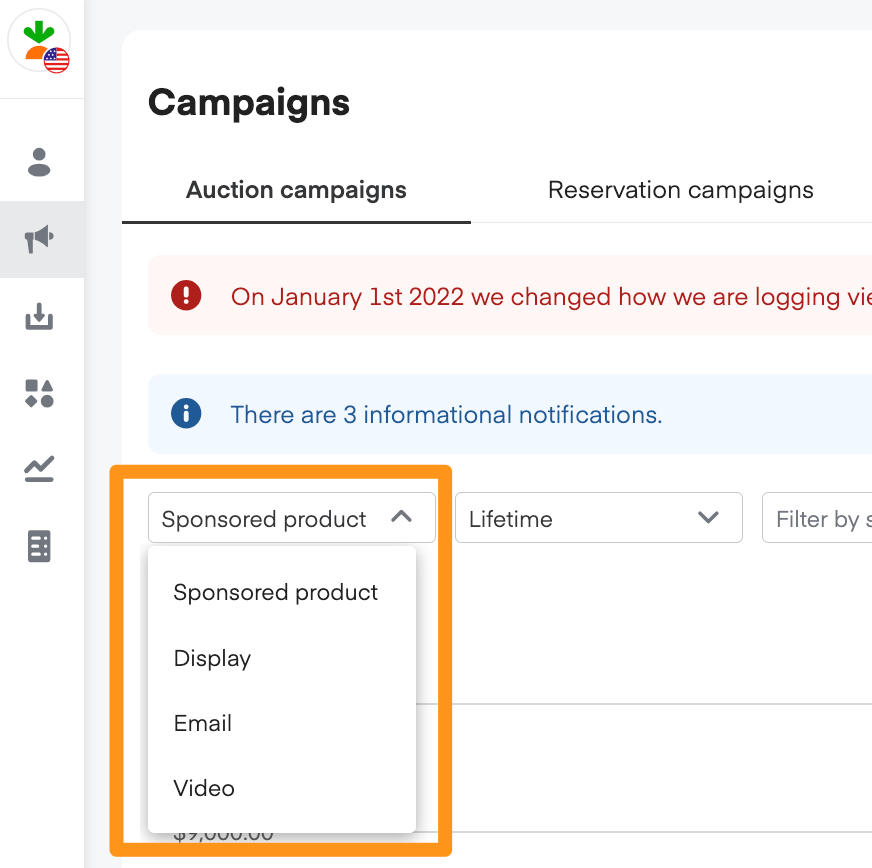
Select Sponsored product from the dropdown in the top-left corner.


The Sponsored product campaigns page shows a graph of analytics for your entire account. You can choose which metric and date range appear in the graph.

Below the graph, Ads Manager lists your sponsored product campaigns and their individual metrics.

From here, you can view analytics for a specific campaign, ad group, sponsored product, or keyword—
Click any campaign from the list to open its Campaign overview page, featuring the campaign’s analytics graph and list of ad groups.
Click an ad group from the list to view its analytics graph.
Click the tabs at the top of the ad group page to view product or keyword analytics.

Campaign impressions and clicks reporting—
We provide additional, more granular reporting for impressions and clicks. Learn more about MRC accreditation.
Go to the sidebar navigation on the left.
Select Campaigns (megaphone icon).

Select Impressions & Clicks from the Export drop-down.

We measure the following click and impression metrics—
Gross clicks: The total number of clicks on any interactive element of an ad. These clicks can include invalid traffic and other event validations. Accredited by the Media Rating Council (MRC).
Gross impressions: Counted when the entire ad is loaded and begins to render on a device. Accredited by the Media Rating Council (MRC).
Net clicks: Clicks on any interactive element of a display or sponsored product ad. This metric refers to gross clicks that are filtered for invalid traffic and other event validations. This metric refers to clicks in Ads Manager. Accredited by the Media Rating Council (MRC).
Net impressions: Counted when the entire ad is loaded and begins to render on a device. This metric refers to gross impressions that are filtered for invalid traffic and other event validations. Accredited by the Media Rating Council (MRC).
Net viewable impressions: When at least 50% of the ad is viewable on a device for at least 1 second. Impressions in Ads Manager are considered “viewable impressions” and are filtered for invalid traffic and other event validations. Accredited by the Media Rating Council (MRC).
- Note: This metric refers to impressions in Ads Manager.
Net non-viewable impressions: A net impression that’s recorded but doesn’t meet MRC requirements for viewability, which requires at least 50% of the ad to be viewable for 1 continuous second. Accredited by the Media Rating Council (MRC).
Net unmeasurable viewable impressions: A net impression that’s recorded but the ad was served in an environment in which its viewability can’t be measured. Accredited by the Media Rating Council (MRC).
Net viewable rate: Net viewable impressions divided by (net viewable impressions + net non-viewable impressions). Accredited by the Media Rating Council (MRC).
Net measured rate: (Net viewable impressions + net non-viewable impressions) divided by net impressions. Accredited by the Media Rating Council (MRC).
Net viewable %: Net viewable impressions divided by net impressions. Accredited by the Media Rating Council (MRC).
Net non-viewable %: Net non-viewable impressions divided by net impressions. Accredited by the Media Rating Council (MRC).
Net unmeasurable %: Net unmeasurable viewable impressions divided by net impressions. Accredited by the Media Rating Council (MRC).
Export your analytics
You can export the data from your analytics graph to a CSV file.
Click Export in the top right corner of the Sponsored product campaigns page to export data for your entire account.

To export data for a specific campaign, click the campaign name to open its Campaign overview page. Then, click Export.
After clicking Export—
- Decide whether you want to export Aggregated data (total amounts) or Daily data (broken out by day).
Choose an option from the dropdown.
Note: the All campaigns option is only available from the Sponsored product campaigns page.

The CSV file downloads to your device.
