The Insights Center provides data and metrics on your brands’ performance. Access sales and share data at the daily and universal product code (UPC) level from across the Instacart Ads ecosystem in a syndicated hierarchy with thousands of categories and subcategories rooted in the Nielsen hierarchy. You can create, customize, save, and export reports subject to Instacart’s data licensing terms.
You can access the following metrics in the Insights Center—
Sales: The total dollar amount of your products that were purchased in the selected super category, category, or sub-category
Sales change: The percentage change in purchases in the selected period compared to the same period the previous year
Sales (last year): Total sales dollars in purchases for the selected time period last year
Units: The total quantity of products purchased in the selected category from your brand
Units change: The percentage change in units purchased in the selected period compared to the same period the previous year
Units (last year): Total units sold in the selected time period last year
Market share: Your sales as a percentage of total sales based on your selections
Customer share: The percentage of customers that purchased your products within the selected super category, category, or sub-category
Basket share: The percentage of unique purchases that contained your products in the selected super category, category, or sub-category
Jump to—
Accessing your data
To access the Insights Center—
Go to the navigation bar on the left-hand side in Ads Manager (ads.instacart.com).
Click Customer insights (graph icon).

Select Sales and market share from the expanded menu, depending on what metrics you want to view for your brand(s)
From here, you can select the date range of data and metrics you want to review, filter the view, and change how you want your data broken down—by brand, category, department, and more.
Note: Agencies can only see your data if an admin or user manager gives them access. Learn more about adding users to your account.
Creating reports
There are several options you can use to define what data and metrics you want on your insights report. You can view your data in a Trend view or a Table view.
NOTE: This only applies to the Sales & share page.
Trend view
You can select up to 2 metrics to view at 1 time and select as many breakdowns as available.
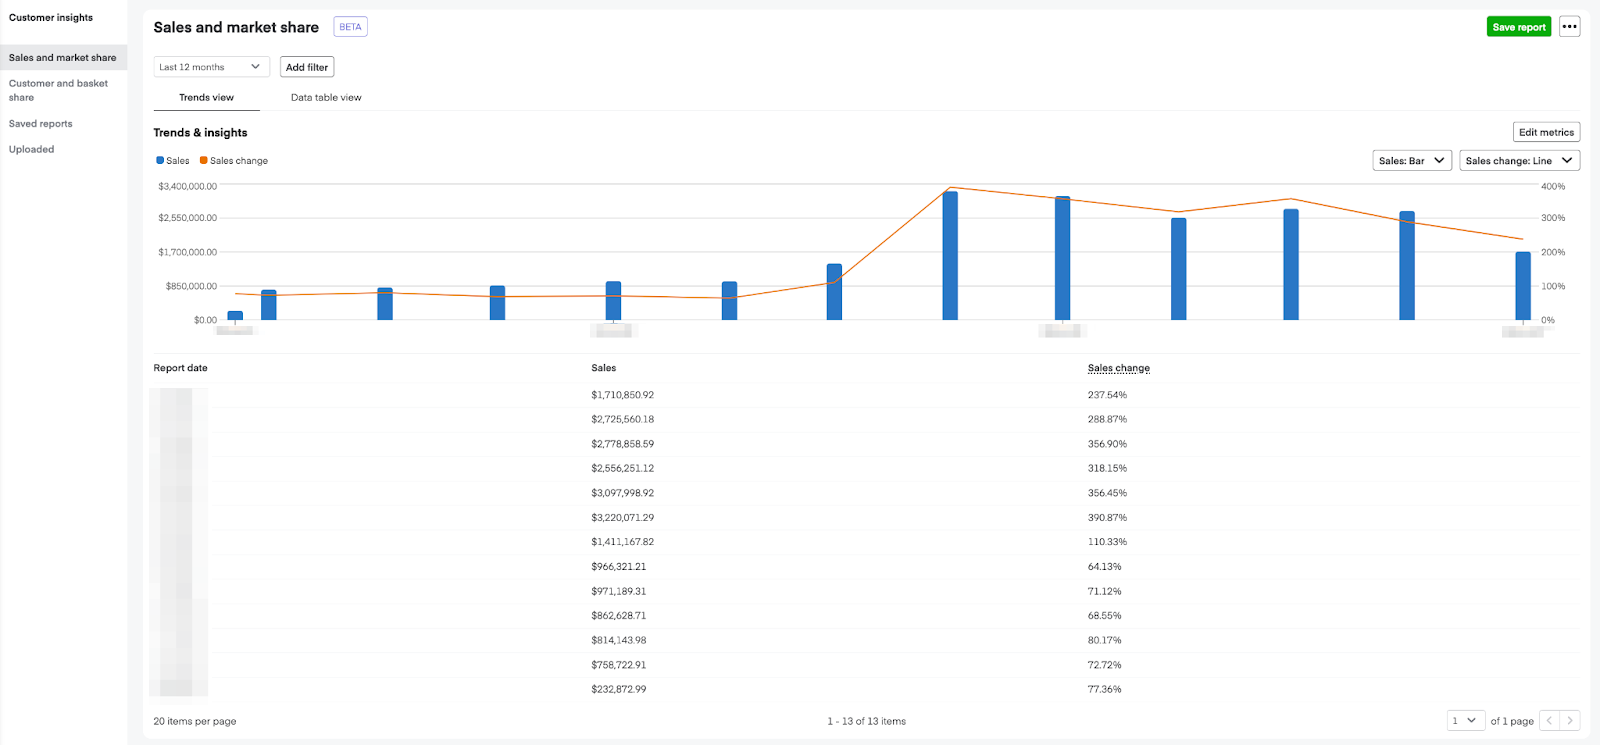
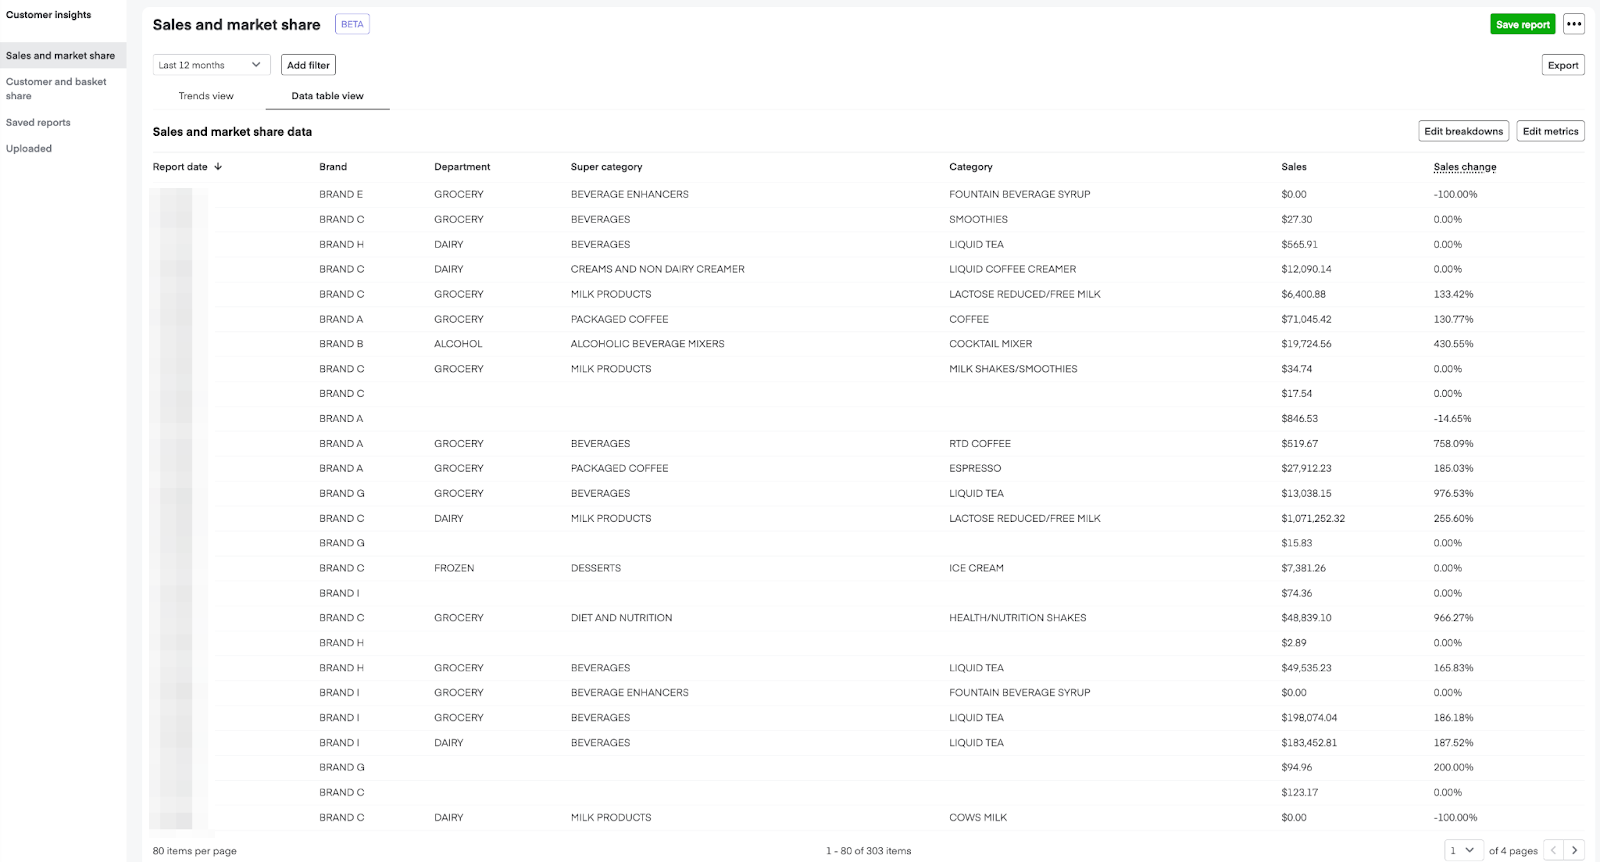
Table view
You can select as many metrics and breakdowns as available.
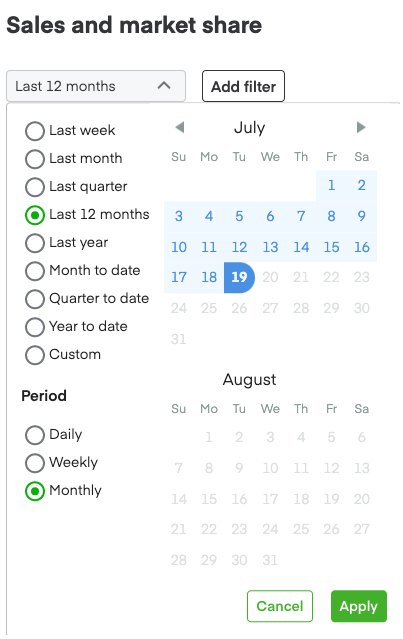
Select date range
On the Sales and market share page, we have more extensive and flexible date filtering capabilities. You can report on data from up to 2 years ago on a monthly, weekly, or daily basis.
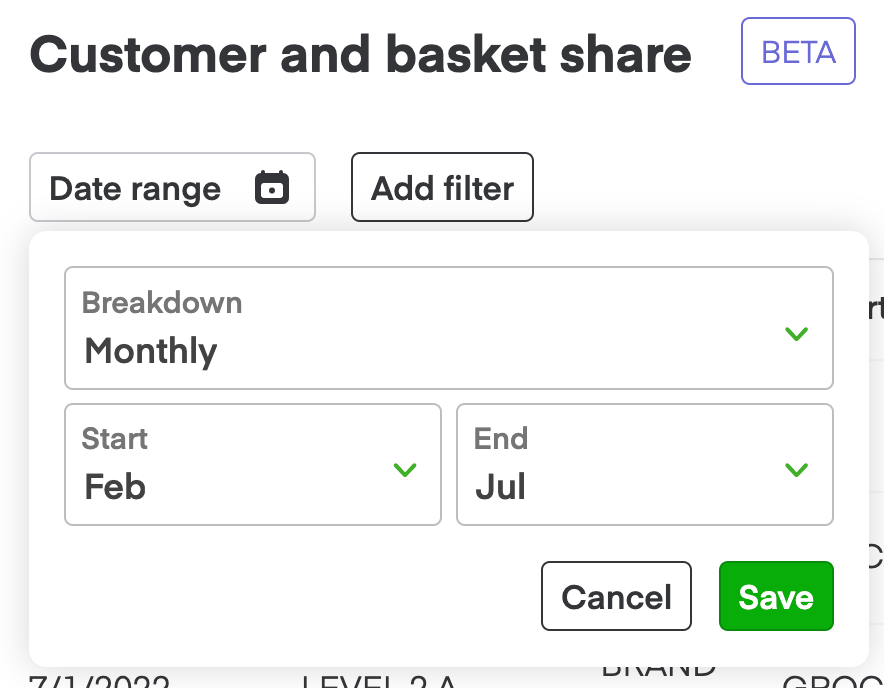
On the Customer and basket share page, you can report on data from up to 2 years ago on a monthly or weekly basis. You can select a date range of up to 6 months.
For daily level data, you can select up to a 14-day range. Data is available at 12 pm ET 4 days after the end date. For example, if you pull data from December 28th - January 1st that data will be available on January 5th at 12 pm ET.
Saved reports with relative date ranges continually update for the specified range. For example, reports with the range of “Last month” always show data for the last month on the date of report view.
The reporting week starts on Sunday and ends the following Saturday. You can also choose for your week to run Monday through Sunday. To update these settings—
Click the ellipsis button in the top-right corner, then click Settings.
Next to Start week on, choose either Sunday or Monday from the drop-down menu.
Click Save.
Your selection applies to all your future visits. Each person with access to your account can select their own reporting view.
Edit breakdowns & metrics
Insights reports can include a variety of metrics on your brands’ performance. Your report breakdown can display metrics for individual reporting levels and categories. Each breakdown adds a column to your report, further categorizing your data.
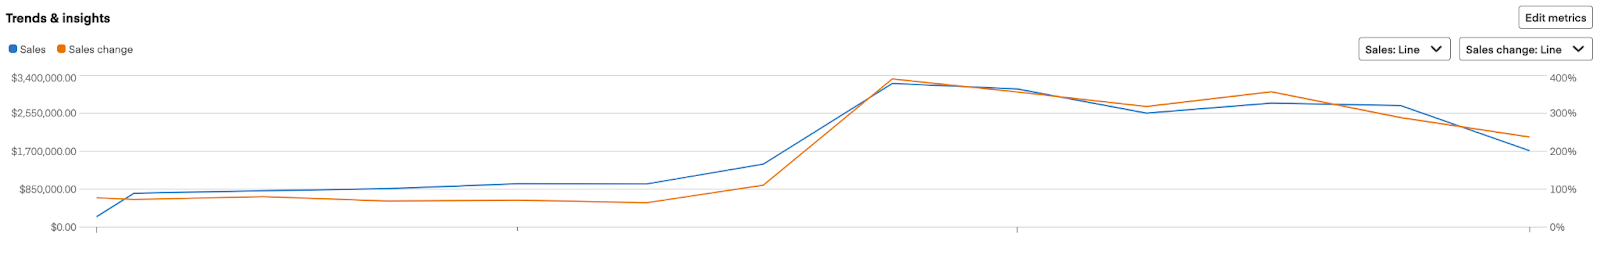
You can view your report as a bar graph or line graph, depending on your preference. To select metrics—
Click Edit metrics.
Select the checkbox next to a metric to include it on your report.
Click Save.
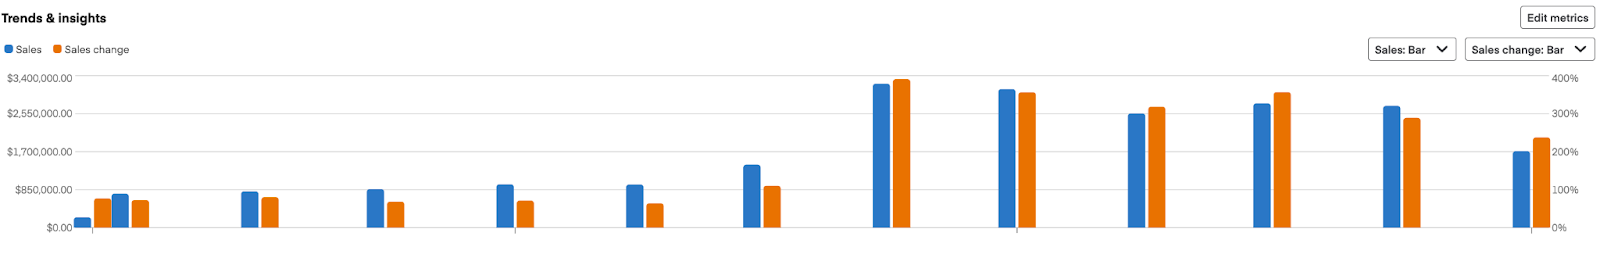
Bar graph view
Line graph view
Edit breakdowns
To edit the report breakdown—
Click Edit Breakdowns.
Select the checkbox next to a breakdown to include it in your report.
Click Save.
In your Customer and Basket share reports, Department and Super category are always displayed as columns.
Additionally, certain breakdowns will always be grouped together depending on their nested relationship. If you select the lowest level, then the higher levels will be included by default. For example, under the Level breakdown, selecting UPC will include Brand and Reporting level 2 level breakdowns in your report. Under the Category breakdown, selecting Sub category will include the Category level breakdown in your report.

Your graph will reflect data based on the timeframe you selected. For example, if you view sales by Month, Brand, Category, and Sub category as breakdowns for your data table, the graph’s default view will show the sum of sales by month.
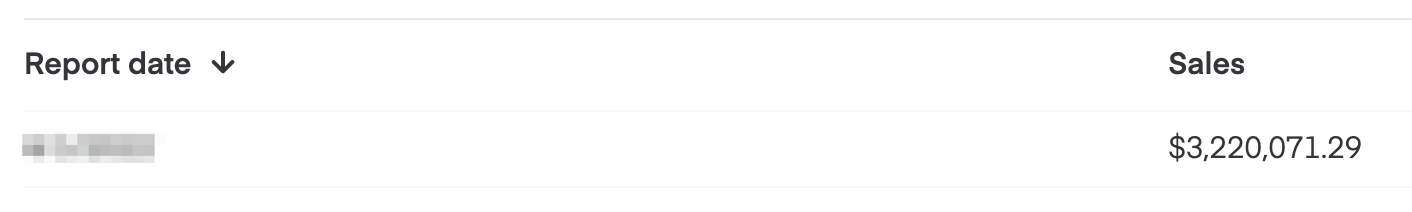
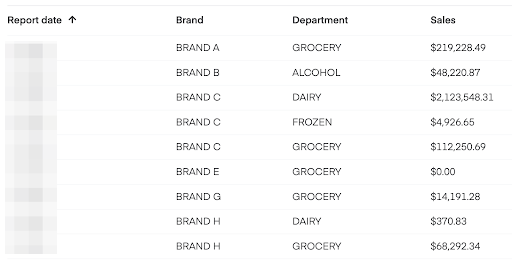
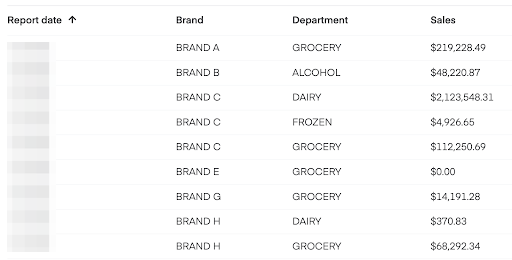
Here’s an example of the same report with different breakdowns selected. Without breakdowns, the example report only shows total sales.
Breakdown | Report view |
None |
|
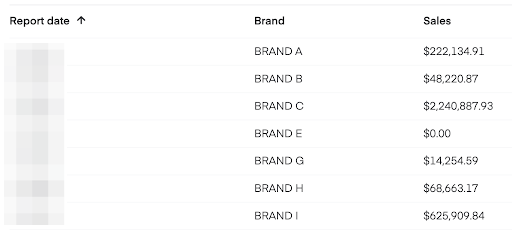
Brand |
|
Brand and department |
|
Filter reports
Filters narrow your report’s focus and remove data you don’t need. Your report only includes data from the filter(s) you select. You can filter by the following attributes—
Brand
Department
Super category
Category
Sub category
UPC
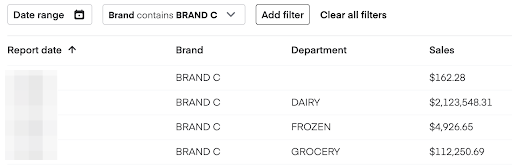
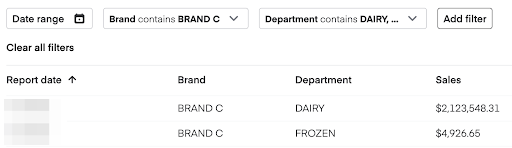
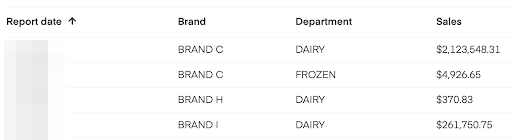
Here’s the example report from the previous section broken down by brand and department with different filters selected. Without selecting filters, the report shows data for all brands and departments within the selected time frame. Filtering by brand = Brand C and department = dairy, frozen shows Brand C’s dairy and frozen departments’ sales.
Filter(s) | Report view |
None |
|
Brand = Brand C |
|
Brand = Brand C AND Department = Dairy, frozen |
|
If you filter based on the same attributes as the report breakdown, you see individual metrics for each filter selection. For example, when you break down by brand and department and filter by department = dairy, frozen, the report shows 2 rows for each brand: 1 for dairy and 1 for frozen (wherever the brands contain these selected departments).
Breakdown | Filter(s) | Report view |
Brand and department | Department = dairy, frozen |
|
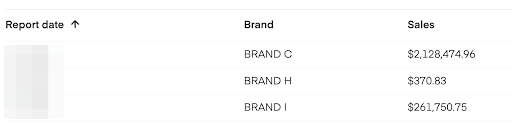
If you filter based on attributes not in the report breakdown, you can see the combined metrics for all filter selections. For example, when you break down by brand and filter by Department = dairy, frozen, the report shows 1 row for each brand. Each row shows the combined sales for both the dairy and frozen departments. NOTE: This applies only to the Sales and market share page.
Breakdown | Filter(s) | Report view |
Brand | Department = dairy, frozen |
|
To filter your insights report—
Click Add filter.
Select the attribute you want to filter on from the first drop-down list.
In the second drop-down list, choose as many value(s) as you’d like to include in your report.
Click Save.
Repeat steps 1-4 to add more filters.
When adding multiple filters, you see options based on the filters you already added. For example, if you add a filter for the frozen department and then filter by super category, you only see super category options that fall under the frozen department.
NOTE:
In order to view market share in a graph, you need to filter by Category.
Multi-selection filtering only works in the data table view. For example, in the data table view you can filter Category = paper towels AND napkins. In the trends view you can only filter Category = paper towels.
Save reports
Once you define your report settings, you can save it for future reference. The platform updates daily with fresh data so you can re-run saved reports against new date ranges without recreating the report.
To save your report—
Click Save report.
Type a name for the report.
Click Save.
Export reports
You can download a CSV file of your insights report exactly as it displays online —including any filters and breakdowns you set—by clicking the Export button.

Please leave Ads Manager open until the file downloads.
Download reports
To download uploaded and saved reports—
Go to the navigation bar on the left-hand side.
Click Customer insights (graph icon).
Click Uploaded or Saved Reports.
Click the download button in the Actions column next to the report you want to download.
Please leave Ads Manager open until the file downloads.
FAQs
How does Instacart calculate market share?
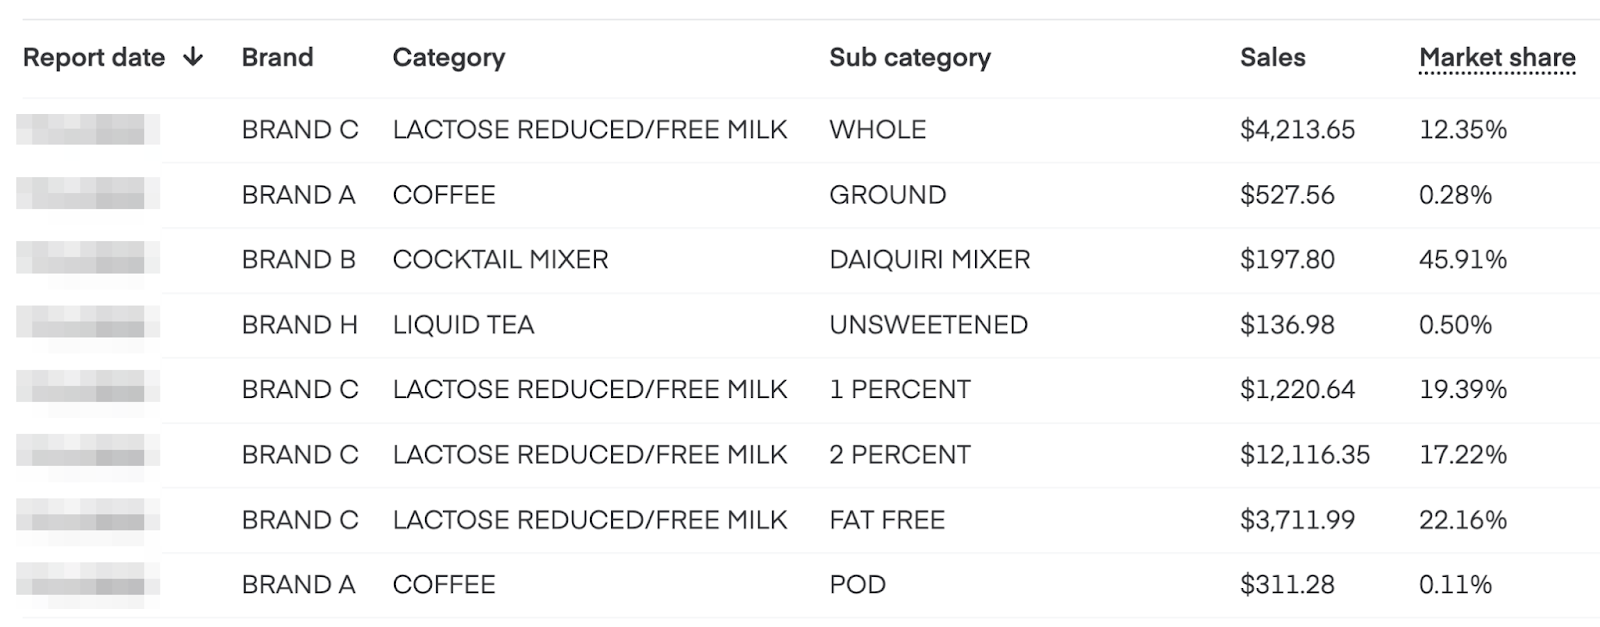
Using a taxonomy breakdown rooted in the IRI and Nielsen hierarchies, we look at the category selections that apply to your selected time range, then divide the sales in your brand by the sales across all products under the same category within those dates.
For an example, see the first row below. The sales for Brand C's lactose reduced/free milk, whole, for the week of July 11, 2021, divided by Instacart’s total sales of lactose reduced/free milk, whole, for the same week equals Brand C’s lactose reduced/free milk, whole, market share for the week of July 11, 2021.
How does Instacart calculate basket share and customer share?
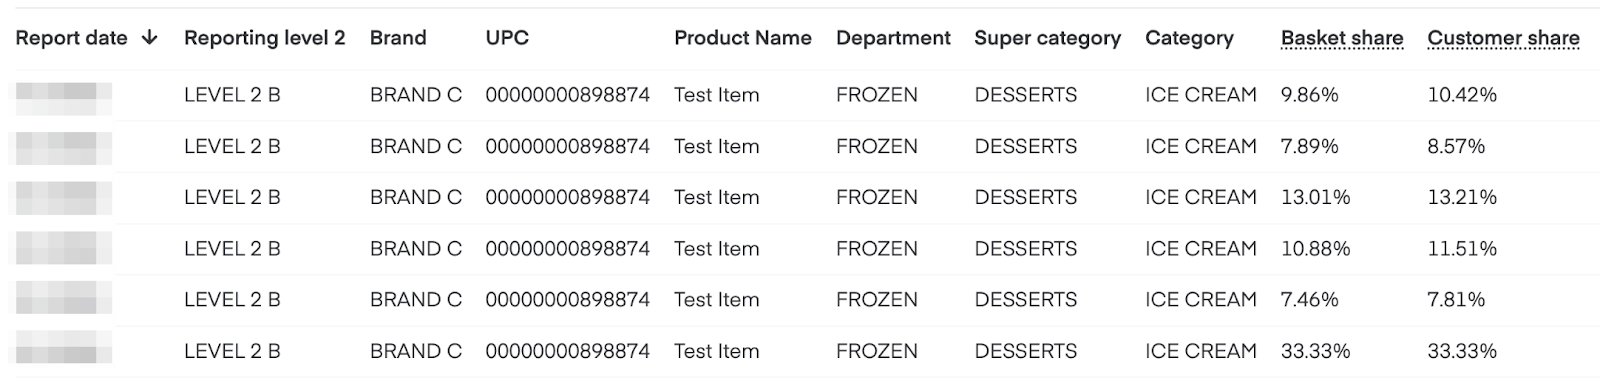
Basket share is calculated as the percentage of unique purchases that contained your products in the selected super category, category, or sub-category.
Customer share is calculated as the percentage of customers that purchased your products within the selected super category, category, or sub-category.
For an example, see the first row below. Brand C accounts for 9.86% of unique purchases where an Ice Cream product was purchased in July 2022. In addition, out of all customers who purchased Ice Cream in this month, 10.42% of them purchased from Brand C.
How soon can I see new data?
At the daily level: 4 days later at noon ET. (For example, data from January 1 is available on January 5). NOTE: This applies only to the Sales and market share page.
At the weekly level: The following Sunday or Monday at noon ET, depending on which day your reporting week starts.
At the monthly level: The first day of the following month at noon ET.
How does Instacart define entity and category hierarchies?
Instacart roots entity and category hierarchies in IRI and Nielsen data.
What types of reports are available?
Two types of reports are available: 1) Sales and market share and 2) Customer and basket share. Reports available and the categories of information within them are subject to change at any time at Instacart’s sole discretion.
Who can access the Insights Center?
Current advertisers on the Instacart platform, including those parties they have authorized to access their Ads Manager account, can access the Insights Portal on our platform. Eligibility requirements are subject to change at any time in Instacart’s sole discretion.
How far back does the data go?
The portal stores 2 years of data. When we add new data, we remove the oldest data. The storage timeline is subject to change at any time in Instacart’s sole discretion.
Why can I only see 14 days at a time at the daily level on the Sales and market share page?
We limit data access to 14 days at a time to keep the portal fast and efficient.
What Instacart products and platforms are trackable in the Insights Center?
You can track your ad performance across all grocery ecommerce partners, and Instacart Marketplace within the Instacart Ads ecosystem. This includes total sales and share data from more than 240 grocery ecommerce partners. These insights help you understand your ROI and see how your ads affect brand health across the full shopping experience.
Some retailers don’t report on every metric in the Insights Center, so certain data may not be available for all partners.
Why do I see different numbers in the Sales and Market Share, Customer and Basket Share, and Uploaded tabs?The Instacart Ads ecosystem includes partners that can use a combination of Instacart or their own shoppers to fulfill orders for delivery or pickup. Because of this, you may see differences in a few reports.
The Sales and Market Share and Customer and Basket Share tabs include data from retailers that don’t use Instacart shoppers. The Uploaded tab only includes data from retailers that use Instacart shoppers.
Who do I reach out to with additional questions?
Please reach out to your account team.